Design Compelling Dashboards with Tableau: For Data Analysis and Stakeholders
Dashboards are powerful visual tools that help you tell your data story. A dashboard is a tool that monitors live,

Dashboards are powerful visual tools that help you tell your data story. A dashboard is a tool that monitors live,
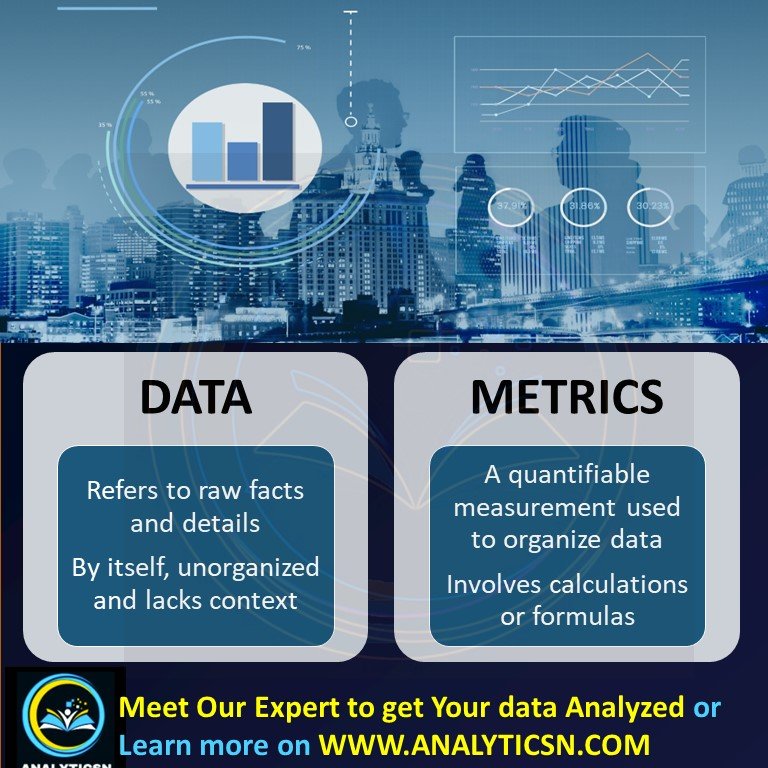
Understanding the difference between data vs. metrics is crucial for turning raw facts into actionable insights. While data consists of unorganized information, metrics are quantifiable measurements that provide context and help track performance. By converting data into metrics, businesses can make informed decisions and drive success.
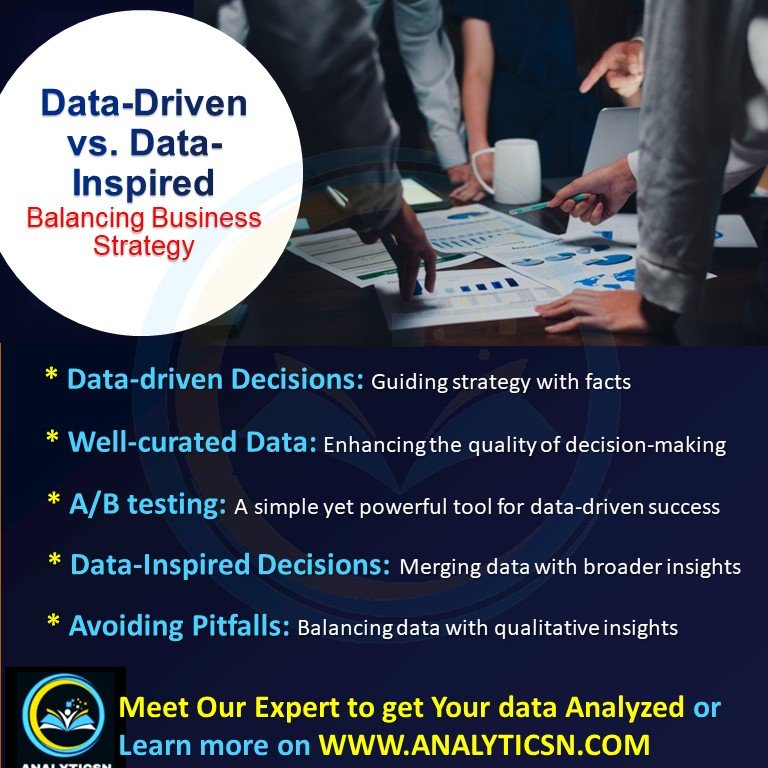
The differentiation between Data-Driven and Data-Inspired Decision Making to successfully Navigating the Balance for Effective Business Strategy

Data analysis is vital for informed decision-making, optimizing processes, and solving problems. Companies like Google use it to enhance efficiency, such as cutting data center energy use by 40%. Despite its potential, challenges in data access and interpretation underscore the importance of skilled analysts.
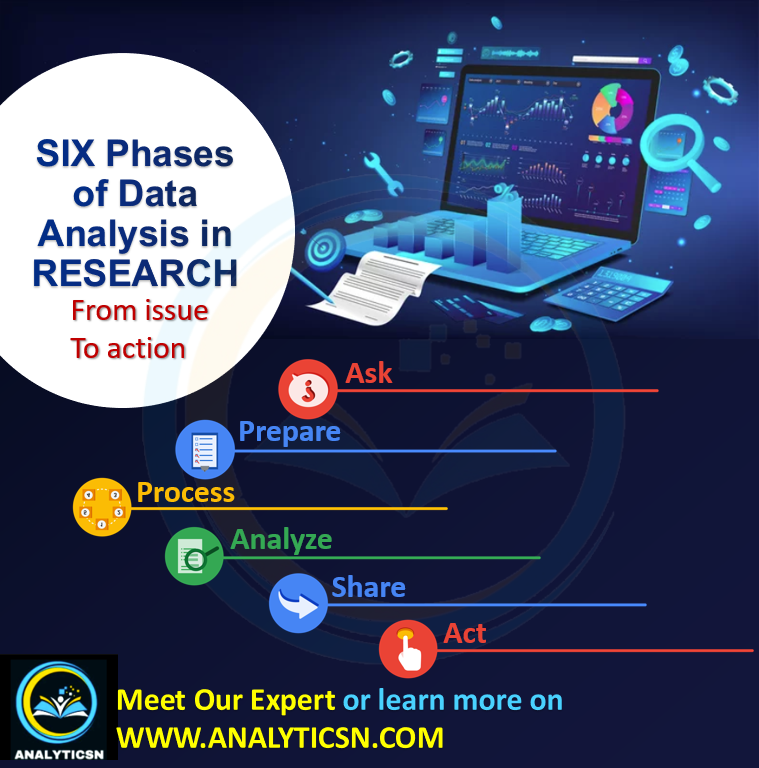
Learn about the six essential data analysis phases: ask, prepare, process, analyze, share, and act. Discover how these steps help solve business problems through structured thinking, from defining issues and cleaning data to sharing results and taking action based on analysis. Perfect for new data analysts to understand and implement effective decision-making processes.