Correlation Analysis: A Key Statistical Tool for Data Interpretation
Introduction to Correlation Analysis
Correlation analysis is an essential statistical method used to evaluate and interpret the relationships between two or more variables. It allows researchers to quantify the degree of association between variables, helping them uncover trends, patterns, and interdependencies within data sets. Whether you’re analyzing market trends, scientific data, or social behavior, understanding correlations provides valuable insights for decision-making and hypothesis testing. This article explores the concept of correlation, the different types of correlation coefficients, and how they are applied in research and data analysis.
What is Correlation?
In statistical terms, correlation refers to the relationship between two random variables or data sets. It measures how variables move in relation to one another—whether they increase, decrease, or remain unchanged when compared. This relationship can be either positive, negative, or neutral (no correlation).
Researchers, especially in market studies and social sciences, use correlation analysis to analyze quantitative data collected through surveys, live polls, and other data collection methods. By examining how variables interact, researchers can identify underlying patterns and predict future behaviors or outcomes.
Correlation Coefficient
The correlation coefficient (r) is a numerical representation of the degree to which two variables are related. It quantifies the strength and direction of a linear relationship between two variables. The coefficient ranges from -1 to +1:
- +1 indicates a perfect positive correlation, where one variable increases as the other increases.
- -1 signifies a perfect negative correlation, where one variable decreases as the other increases.
- 0 means there is no correlation or relationship between the two variables.
Researchers often use correlation coefficients to evaluate how well one variable can predict another. For instance, in market research, correlation can help determine whether increasing marketing efforts (independent variable) results in higher sales (dependent variable).
Types of Correlation Coefficients
Pearson Correlation Coefficient (r):
The Pearson correlation measures the linear relationship between two continuous variables. It is the most commonly used type of correlation coefficient.
The formula for the Pearson correlation coefficient is:

Where:
- Xi and Yi are the individual sample points for the two variables.
- Xˉ and Yˉ are the means of the X and Y variables, respectively.
- Pearson’s correlation is suitable when both variables are normally distributed and have a linear relationship.
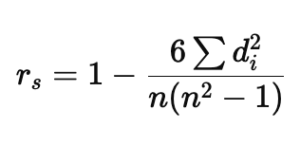
Spearman’s Rank Correlation Coefficient (ρ or rₛ):
Spearman’s correlation is a non-parametric measure of rank correlation, making it suitable for ordinal data or when the assumptions of Pearson correlation (normality and linearity) are not met.
The formula for Spearman’s rank correlation is:

Where:
- di is the difference between the ranks of corresponding variables.
- n is the number of observations.
- Spearman’s correlation evaluates the monotonic relationship between two variables, making it useful when the relationship is not strictly linear but still shows a pattern.
Interpreting Correlation Coefficients
Interpreting the value of the correlation coefficient is crucial for understanding the strength and direction of the relationship between variables.
- Strong Positive Correlation (+0.5 to +1): As one variable increases, the other variable also increases. The scatter plot of the data will show an upward-sloping line. For example, the correlation between education level and income might exhibit a strong positive correlation.
- Weak Positive Correlation (0 to +0.5): The variables are positively correlated, but the relationship is weaker, with points scattered further from the line.
- No Correlation (0): There is no discernible relationship between the variables. The scatter plot would show a random distribution of points.
- Weak Negative Correlation (0 to -0.5): As one variable increases, the other decreases slightly. The points on the scatter plot show a loose downward trend.
- Strong Negative Correlation (-0.5 to -1): A strong inverse relationship exists, meaning as one variable increases, the other decreases significantly. The scatter plot will show a clear downward-sloping line.
Application of Correlation in Research
Correlation analysis is widely used across different fields, including business, economics, psychology, and healthcare. It is a fundamental step in hypothesis testing, allowing researchers to test the relationship between independent and dependent variables.
1. Testing Hypotheses: Researchers can test whether there is a statistically significant relationship between variables by calculating the correlation coefficient. If the coefficient is significantly different from zero, they can reject the null hypothesis (which states that no relationship exists).
2. Identifying Trends and Patterns: By exploring correlations, researchers can identify emerging trends and patterns in their data. For example, correlation analysis might reveal a positive relationship between customer satisfaction and brand loyalty, leading companies to invest in customer experience improvements.
3. Predicting Outcomes: Correlation analysis helps predict how changes in one variable may influence another. For instance, in finance, researchers may explore the correlation between stock prices and interest rates to predict market trends.
4. Guiding Further Research: Strong correlations can serve as starting points for further investigation. For example, if a study finds a strong negative correlation between sleep quality and work productivity, researchers might conduct more detailed studies to explore the causal relationship.
SPSS and Correlation Analysis
SPSS (Statistical Package for the Social Sciences) is one of the most popular tools for running correlation analyses. It provides researchers with the ability to calculate both Pearson and Spearman correlation coefficients easily and interpret the results effectively. At AnalyticsN, we specialize in helping researchers conduct these analyses, offering tailored SPSS support throughout your research journey.
Our SPSS experts guide you through data collection, hypothesis testing, and interpretation of results, ensuring you gain valuable insights from your data. Whether you are dealing with complex datasets or simple bivariate data, our team ensures prompt and accurate analysis, enabling you to make data-driven decisions with confidence.
